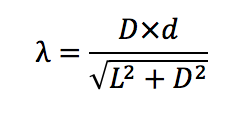
For all three experiments we used the following setup to find the associated wavelengths of visible light from violet to red and then the spectra for an unknown gas and at the end compare measured spectral lines of Hydrogen to actual values..
L= Distance between the diffraction grating and the light source = 2±0.02m
the large uncertainty on L is due to the fact that the light source could not be perfectly put on the zero mark and so we moved the diffraction grating in a way to get as close as possible to 2 meters.
D= Distance to the light line seen through the grating (in this case start of red)
the large uncertainty on L is due to the fact that the light source could not be perfectly put on the zero mark and so we moved the diffraction grating in a way to get as close as possible to 2 meters.
D= Distance to the light line seen through the grating (in this case start of red)
λ=wavelength of the light line
d=grade of the diffraction grating= 2×10⁻⁶ m (500 slits per mm)
First Experiment : White Light Spectra
 |
| This is the light spectra of a light bulb through diffraction grating |
If we compared the data from the experiment to the actual values the only ones that are not matching within the uncertainty are green and orange. The reason is before green is cyan and before and after the orange are yellow and red respectively. In both cases it was hard for both of us to differentiate exactly the beginning of the those two colors. So we should just increase the uncertainty in the measurement to about 20 nm.
Another error corresponding to the uncertainty is the fact that the small angle approximation does not hold true in this experiment since the smallest value for it is from violet.
D=0.39 which gives an angle of 11 degrees or 0.193 rad. the sin of this angle is 0.193 which still holds true for small angle approximation but with red and D=0.7775 the angle is 0.37 rad 0.362. These differences though not big, still add to the overall uncertainty.
Second Experiment : Unknown Gas
The exact setup as the first experiment was implemented. The same measurements were taken and same formulas were used.
The exact setup as the first experiment was implemented. The same measurements were taken and same formulas were used.
 |
| The Unknown Gas's Spectral Lines Through the Gratings |
After observing the spectral lines and obtaining wavelengths values we compared these values with given other gases' spectral line we concluded that the gas was Helium. Eventually it turned out that the gas was Mercury.
The one before last spectra is Mercury and the one before that is Helium. From this picture it is obvious why we confused the two together.
This graph is a graph of the linear relationship between the actual wavelength to calculated one. This equation for the graph acts as a linear adjustment that compensates for systematic error and any faulty steps.
with the new linear adjustment the error becomes less than 1%.
Third Experiment :
Third experiment is the repeat of second one, however in this one the gas is known which is Hydrogen. The goal is to compare our measured values to actual values and see if our linear adjustment is still a true adjustment.
The uncertainty on the adjusted wavelengths is the same as primary calculated wavelength since the transformation is linear that number does not change.
After comparing the values it is proven that firstly this gas is truly Hydrogen and secondly our linear adjustment is a total error annihilator.


No comments:
Post a Comment